Dashboard Business Intelligence (BI) Tool
Dashboard is Intellicene NowForce's Business Intelligence tool developed for quality of service analysis, event evaluation and enhanced performance reporting.
The Dashboards tool provides customers with a detailed analysis of the data collected in the system. The data is provided with clear visuals and also available in formatted reports, allowing for effective analysis to assist future decision making.
This tool is an add-on license to an existing Admin named user license in a SaaS environment.
To access the Dashboard
Select the dashboard icon from the Dispatcher main task bar.
![]()
If you do not see the Dashboard icon it may be either because you do not have the BI license added to your profile or because the dashboard has not been configured for your organization. To resolve this, contact NowForce Support.
Available Dashboards
There are a set of default dashboards pre-configured to your organization. These dashboards cover multiple domains of your operations on NowForce system: Users, Incidents, Geofences etc. Each dashboard can be filtered and modified based on time filters and other parameters.
Incidents Dashboard
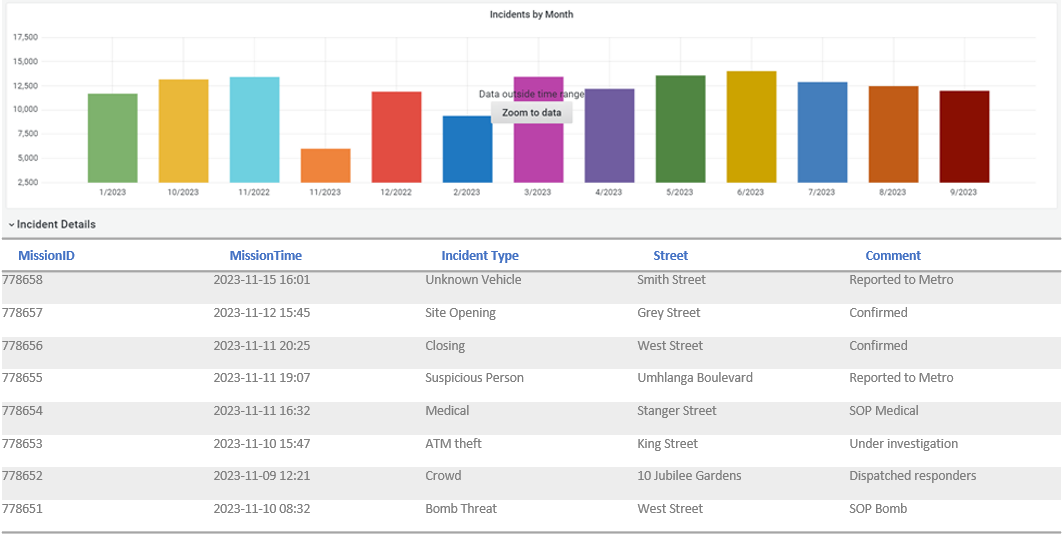
This dashboard provides an overview on incident statistics and allows you to drill down into the incident types and the status of incidents both current and closed in the organization.
The data is organized systematically into daily, monthly and annual occurance according to Incident type. Shown below is the following
- Incidents by priority
- Incidents by type
- Frequency of incidents (total) by day and year, or other time intervals
- Incidents by month with a data table
.png)

Users Dashboard
The Users dashboard provides data per user group in your organization. Data is displayed by:
- Number of Users per Group
- Users allocated in each Profile
- Number of incidents created by Users (Reporters)
- The number of incidents responded to by Users (Responders)
.png)
Geofence and Map Data Dashboards
In addition to providing dashboards about Incidents and Users,your organizational data can be displayed according to your geofence boundaries. Dashboards providing mapped and geo-referenced data included the following as shown:
- Incidents by Map Location
- Incidents by Geofence (listed)
- Distribution of Incidents within Geofences (graphic)

Additional Dashboard Configurations
Additional bespoke Dashboards for your organization can be ordered from the NowForce Professional Services team. Contact NowForce Support for more information.
